
In June, legions of graduates feel the momentary joy of accomplishment just before the reality of becoming a responsible adult sets in. It’s also when Eduventures pays tribute to the institutions that best help their students navigate to graduation through our annual retention ratings. This year, we’ve also learned and grown and have graduated to a more comprehensive rating system that accounts for both retention and completion. It’s certainly not a complete definition, but these two metrics are some of the first indicators of student success.
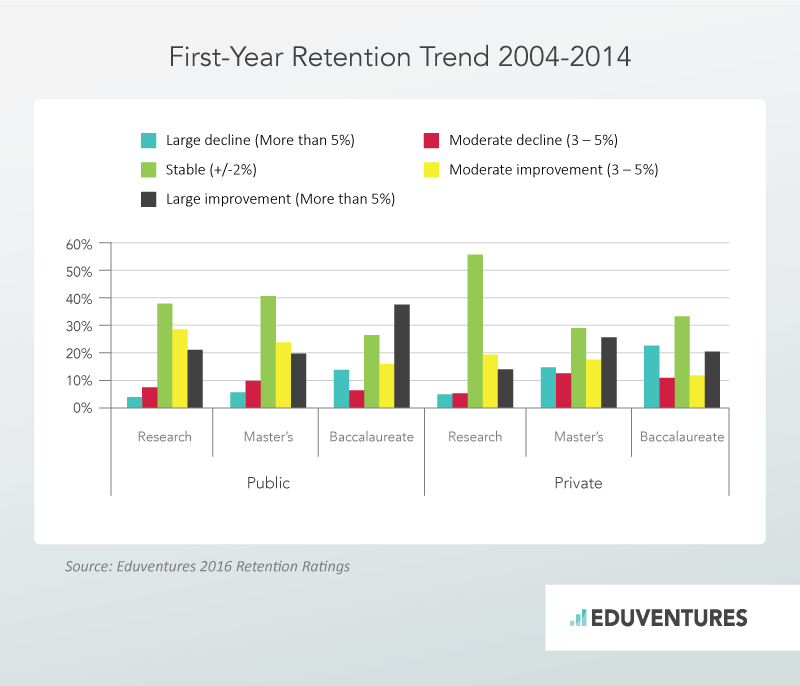
Before we get to the ratings, let’s understand the landscape for student success in the last ten years. As a whole, public institutions have improved both retention and graduation rates more than private institutions. While public institution improvement has been modest (2.6% retention, 4.5% graduation), private institution improvement has been negligible (0.3% retention, 1.2% graduation). These overall numbers can look a little bit anemic in an industry where student success is top of mind. The story becomes much more interesting when you segment the strong performers from the others for both private and public institutions.
 Note: Institutions classified using a simplified Carnegie Classification.
 Note: Institutions classified using a simplified Carnegie Classification.
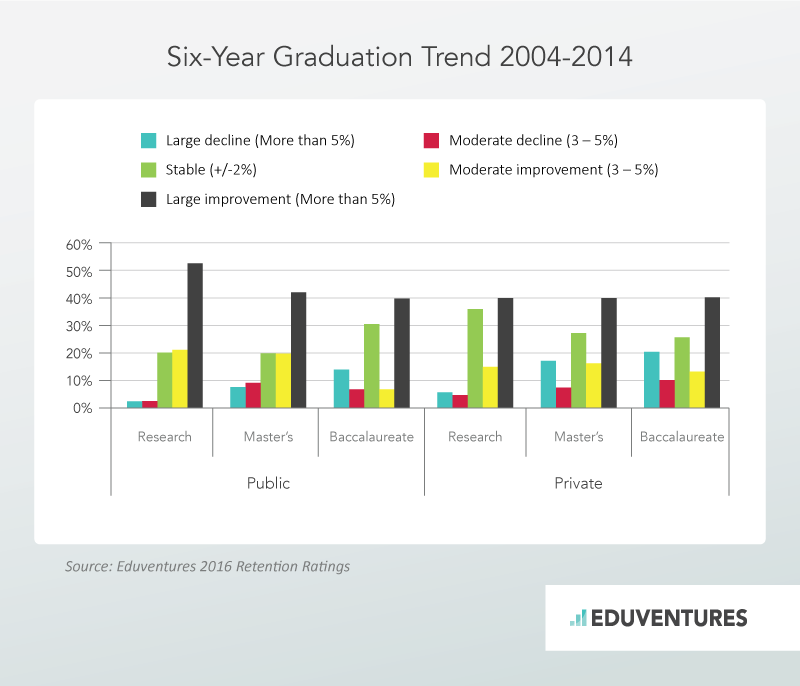
The largest improvements are in six-year graduation rates at public institutions. For example, more than half of research-level public institutions have improved their six-year graduation rates by more than 6% in ten years. Private baccalaureate-level institutions are struggling the most, with larger declines than improvements in first-year retention. Our new student success ratings seek to find the strong performers that have beat the market on student success in a number of ways. In order to do so, we’ve expanded our rating method to include not only first-year retention, but also six-year graduation rates in a combined index of student success.
In addition, we’ve refined our ratings method to add depth to our analysis. Historically, the hallmark of our retention ratings has been that it scores how institutions perform on first-year retention given their institutional circumstances. This measurement of an institution against its own circumstance is still extremely important. This year, we’ve added trend data to the analysis to credit institutions that have made sustained improvement in measures of student success.
With these two big ideas, performance given institutional circumstance and performance trends over time, we created four specific measures. The first two measures are derived from our linear regression model of predicted student success with inputs from across a variety of variables, including institutional characteristics and academic, social, affordability, and demographic factors. The second two are built upon 2004 to 2014 first-year retention and six-year graduation trend data. These four factors are:
Note: Institutions classified using a simplified Carnegie Classification.
The largest improvements are in six-year graduation rates at public institutions. For example, more than half of research-level public institutions have improved their six-year graduation rates by more than 6% in ten years. Private baccalaureate-level institutions are struggling the most, with larger declines than improvements in first-year retention. Our new student success ratings seek to find the strong performers that have beat the market on student success in a number of ways. In order to do so, we’ve expanded our rating method to include not only first-year retention, but also six-year graduation rates in a combined index of student success.
In addition, we’ve refined our ratings method to add depth to our analysis. Historically, the hallmark of our retention ratings has been that it scores how institutions perform on first-year retention given their institutional circumstances. This measurement of an institution against its own circumstance is still extremely important. This year, we’ve added trend data to the analysis to credit institutions that have made sustained improvement in measures of student success.
With these two big ideas, performance given institutional circumstance and performance trends over time, we created four specific measures. The first two measures are derived from our linear regression model of predicted student success with inputs from across a variety of variables, including institutional characteristics and academic, social, affordability, and demographic factors. The second two are built upon 2004 to 2014 first-year retention and six-year graduation trend data. These four factors are:
Top public research/doctoral institutions have made many improvements and outperform their predictions, but they still have work to do. The top performer, University of South Florida, receives very high marks for improving its graduation rate and good—but not great—scores across the other dimensions. That’s good work, but they won’t be satisfied with the results yet.
This category also shows us evidence of a state system putting its weight behind student success initiatives. Four Florida State University System campuses are in the top 12 (University of South Florida, University of Florida, University of Central Florida, and Florida State University). In its 2005-2025 strategic plan, the Florida State University Board of Governors gave its institutions the goal of improving “degree proficiency and program efficiency.” One of the metrics against which they will measure this goal is an improvement across the system to a 70% six-year graduation rate. The state also moved to a performance-based funding model in 2016. This shows what the power of a well-supported mandate can do to stimulate improvement.
Among public master’s-level institutions we see some of the same patterns.
Consistent performance across all four indicators is hard to find among public master’s-level institutions. The top institution, Texas A & M International University, beats the odds given its institutional circumstances, but has made little improvement in retention rates over the years. Most notable is the presence of three California State University (CSU) campuses in the top institutions. In this case, there is not only a CSU system mandate, but we also see evidence of system-wide tools being developed to manage student success. The CSU system has developed a student success dashboard to find at-risk students and develop intervention strategies based on historical data and predictive analytics.
The moral of this story is that there are as many stories of student success as there are institutions. Sustained improvement and performance is hard to come by without a strong executive mandate, a keen understanding of institutional context, and the tools to quickly identify at-risk students, roll out interventions, and measure their effectiveness. We’ve identified institutions that are making progress over time in their own particular circumstance. Look to our future work for in-depth stories of best practices in student success.
In the meantime, see how your institution stacks up in our student success ratings.
Note: Institutions classified using a simplified Carnegie Classification.
Note: Institutions classified using a simplified Carnegie Classification.
The largest improvements are in six-year graduation rates at public institutions. For example, more than half of research-level public institutions have improved their six-year graduation rates by more than 6% in ten years. Private baccalaureate-level institutions are struggling the most, with larger declines than improvements in first-year retention. Our new student success ratings seek to find the strong performers that have beat the market on student success in a number of ways. In order to do so, we’ve expanded our rating method to include not only first-year retention, but also six-year graduation rates in a combined index of student success.
In addition, we’ve refined our ratings method to add depth to our analysis. Historically, the hallmark of our retention ratings has been that it scores how institutions perform on first-year retention given their institutional circumstances. This measurement of an institution against its own circumstance is still extremely important. This year, we’ve added trend data to the analysis to credit institutions that have made sustained improvement in measures of student success.
With these two big ideas, performance given institutional circumstance and performance trends over time, we created four specific measures. The first two measures are derived from our linear regression model of predicted student success with inputs from across a variety of variables, including institutional characteristics and academic, social, affordability, and demographic factors. The second two are built upon 2004 to 2014 first-year retention and six-year graduation trend data. These four factors are:
- Performance given institutional circumstance: The difference in predicted and actual performance on the combined Student Success Index
- Degree of over- or under-performance: The percentage of over- or under-performance given the headroom an institution had for improvement
- Retention trend: The ten-year trend in first-year retention
- Graduation trend: The ten-year trend in six-year graduation
| PUBLIC RESEARCH | OVERALL STUDENT SUCCESS SCORE | PERFORMANCE GIVEN CIRCUMSTANCE | DEGREE OF OVER- OR UNDER-PERFORMANCE | RETENTION TREND | GRADUATION TREND |
|---|
| University of South Florida-Main Campus | 79 | 75 | 77 | 68 | 95 |
| Sam Houston State University | 75 | 77 | 72 | 76 | 76 |
| University of California-Irvine | 72 | 89 | 100 | 43 | 57 |
| University of Minnesota-Twin Cities | 72 | 61 | 66 | 62 | 100 |
| Jackson State University | 72 | 100 | 81 | 57 | 49 |
| University of California-Riverside | 71 | 86 | 85 | 59 | 54 |
| North Carolina A & T State University | 70 | 88 | 77 | 62 | 54 |
| University of Florida | 70 | 72 | 90 | 51 | 68 |
| University of Central Florida | 70 | 67 | 70 | 62 | 81 |
| University of Utah | 69 | 71 | 72 | 57 | 78 |
| Florida State University | 69 | 66 | 74 | 59 | 78 |
| San Diego State University | 69 | 62 | 64 | 57 | 95 |
Showing 1 to 12 of 12 entries
| PUBLIC MASTER'S | OVERALL STUDENT SUCCESS SCORE | PERFORMANCE GIVEN CIRCUMSTANCE | DEGREE OF OVER- OR UNDER-PERFORMANCE | RETENTION TREND | GRADUATION TREND |
|---|
| Texas A & M International University | 73 | 98 | 93 | 29 | 70 |
| California State University-San Bernardino | 72 | 100 | 100 | 24 | 66 |
| California State University-Long Beach | 66 | 71 | 87 | 20 | 88 |
| SUNY Oneonta | 66 | 65 | 82 | 24 | 95 |
| Citadel Military College of South Carolina | 66 | 83 | 99 | 22 | 59 |
| Slippery Rock University of Pennsylvania | 65 | 72 | 84 | 21 | 84 |
| State University of New York at New Paltz | 65 | 65 | 85 | 21 | 89 |
| California State University-Los Angeles | 64 | 81 | 83 | 25 | 66 |
| SUNY College at Brockport | 63 | 69 | 82 | 17 | 84 |
| The University of Texas-Pan American | 62 | 70 | 73 | 25 | 82 |
| Winston-Salem State University | 62 | 87 | 87 | 17 | 57 |
| Ramapo College of New Jersey | 61 | 70 | 88 | 15 | 71 |
Showing 1 to 12 of 12 entries
