In what has become a tradition here at Eduventures, we asked our analysts to reflect on one thing they learned through their research in 2021.
Much like the moment we are in, 2021’s end-of-year learnings show important signs of optimism. Adult bachelor’s prospects, bruised and beleaguered by the pandemic, may finally be regaining some confidence about returning to school. The institutional website—long the most-used information channel in college search—now also rises to most-trusted in a reshaped digital recruitment environment.
But these posts also signal the need for continued vigilance. Adult enrollment gains mask underlying enrollment rate weaknesses and, perhaps, growing microcredential strength. That indefinable feeling of “fit” for low-income, first-generation college students most impacted by the pandemic looks different.
Click the author to jump to each section:
Richard Garrett: Graduate Enrollment Rate and Microcredential Demand
Kim Reid: "Fit" is Much Deeper than Expected
James Wiley: What Transfer Prospects Say They Need
Johanna Trovato: The Hub of Student Recruitment is Not Your Campus
Clint Raine: The COVID Shock May Be Waning for Adult Undergraduate Degree Prospects
Graduate Enrollment Rate and Microcredential Demand
By Richard Garrett, Chief Research Officer
In 2021, I learned that the enrollment rate is just as important as the enrollment count. By “enrollment rate,” I mean the proportion of a qualified population enrolled in a specific level of education.
In August, I wrote about the unnoticed decline in the graduate enrollment rate, defined as the proportion of Americans aged 25-44 with a bachelor’s degree, but no higher, enrolled in graduate schools. This decline was obscured by a graduate enrollment boom.
As a reminder, between 2013 and 2019, total graduate enrollment grew 6%. But also during this time, the graduate enrollment rate fell by 15%. The latter was due to much faster growth in the base population plus a healthy pre-COVID economy. In fact, the graduate enrollment rate cratered in the early weeks of the pandemic to 23% below the 2013 baseline before recovering in 2021.
Recent analysis sheds more light on the most recent graduate enrollment rate trends, raising a seeming contradiction with the latest National Student Clearinghouse data and a potential microcredential conundrum.
Eduventures uses the Current Population Survey (CPS) from the Census Bureau to track enrollment rates. CPS includes a college enrollment question and monitors monthly trends. Figure 1 compares the month-by-month graduate enrollment rate during 2020 and 2021, using the same month in 2019 as a baseline.
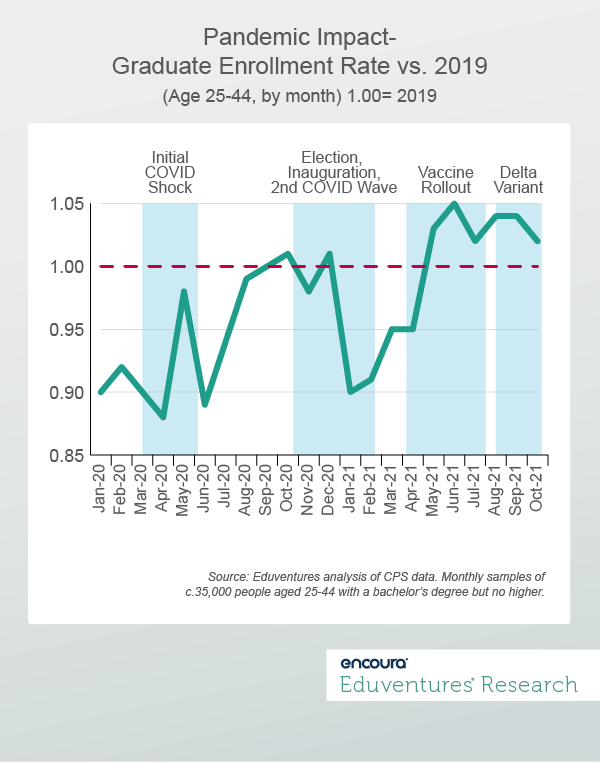
Between January 2020 and April 2021, the graduate enrollment rate was largely subdued below 2019 levels, which in turn had fallen steadily since 2013. The oddity of the COVID recession, plus the turmoil before and after the 2020 election, proved to be anti-enrollment forces. The graduate enrollment rate went briefly positive in October 2020, consistent with graduate enrollment growth that fall.
As the COVID vaccine rolled out, the graduate enrollment rate began to climb, and from May has been consistently above the 2019 baseline.
But the CPS data seems to contradict National Student Clearinghouse figures. The Clearinghouse reported graduate enrollment growth in fall 2020 (+2.7%) but slower growth in fall 2021 (+2.1%). Yet CPS data suggests the opposite: faster growth in fall 2021 (Figure 1). Why?
My theory is that the recent CPS 2021 data shows the scaling up of microcredential programs offered by leading universities with the likes of Coursera, edX, and Emeritus. Enrollment in these programs will not show up in Clearinghouse data, which is confined to credit programs, but it is likely to feature in CPS totals. CPS is a survey of individuals, not institutions, and asks simply about college enrollment.
Look out for more analysis by Eduventures in 2022. Only by grasping enrollment count and enrollment rate, and factoring in the credit-noncredit boundary, can we accurately interpret what is going on in today’s graduate market.
"Fit" is Much Deeper than Expected
Kim Reid, Principal Analyst
This year I learned that “fit”—finding that institution that is just right—is a multi-dimensional concept with both commonalities and important differences among key student segments. I’ve also been thinking a lot about the first-generation, low-income traditional-aged high school students who were most challenged by the COVID-19 pandemic. Many dropped out of the college-bound pipeline. These are students that many colleges and universities are seeking to reconnect with. What does “fit” mean for them?
An analysis of our 2021 Admitted Student Research™ provides the answer. Figure 2 shows the key components of fit for first generation low-income students vs. the general student population.
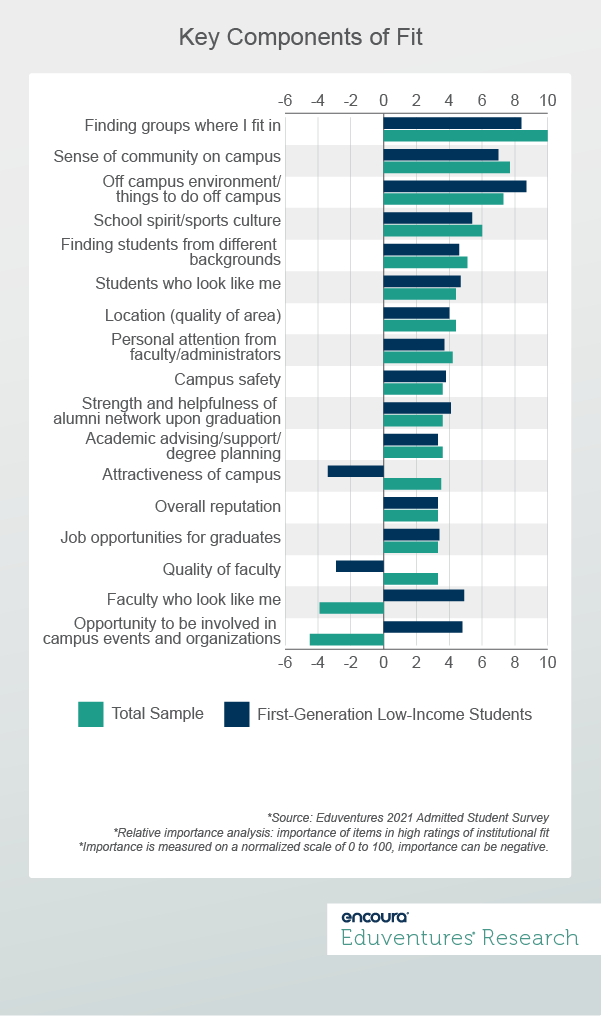
This analysis shows the three main components of fit for all students: “finding groups where I fit in,” “sense of community,” and “off-campus environment.” But there are many secondary components in common, too, like “school spirit/sports culture,” “finding students from different backgrounds,” “students who look like me,” “location,” and “personal attention from faculty,” among others.
There are also key differences. First-generation low-income students made up 15% of all admitted students in our 2021 sample and the vast majority of these students were also students of color (71%). For these students, finding faculty who look like them and the opportunity to be involved in campus events and organizations are both important components of fit. This is not the case for the community of students at large.
On the face of it, we would recommend that institutions consider fit to be the stories of their communities and how students will find their places in them—focusing on values and emotions rather than structural elements. But for this all-important group of first-generation, low-income, largely students of color, the fit story must be all this and more. It must be more explicit. These students are looking for friendly, familiar faces in the faculty, and they are looking for specific activities to connect to in ways that other students are not.
As your institution seeks to reconnect or strengthen links to this population post-pandemic, think about how you can welcome them, and, specifically, how you will show them that they belong at your school.
What Transfer Prospects Say They Need
By James Wiley, Principal Analyst
In 2021, I learned that there is a lesser-understood gap in the transfer process. According to students who have already transferred from community colleges or two-year institutions, getting more advising help from receiving institutions would have helped with their transitions.
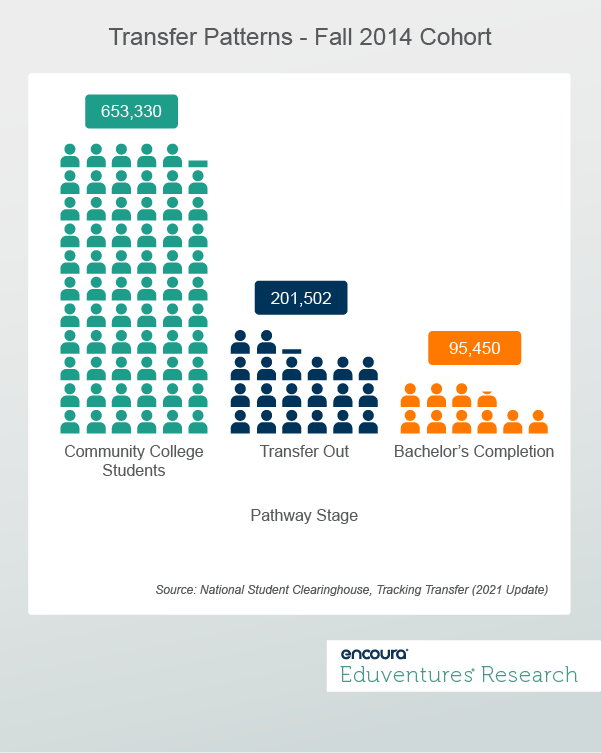
Why is this insight important? We know that advising support provided by community colleges or two-year schools is essential to help transfer students navigate their pathways. But we also know that the vast majority of students at community colleges or two-year institutions—69%—do not transfer at all, perhaps because the transfer process is still too daunting (Figure 3).
Data from our 2021 Transfer Student Research, a national survey of 1,190 transfer prospects and already-enrolled transfer students further reveals this gap. More students leaving community colleges or two-year colleges stated that they could have used more advising support from their receiving institutions (55%) than from their sending institutions (46%). Those transferring from four-year private institutions are also slightly more likely to say they wish they had more advising support from their receiving schools (13%) versus the schools they had been attending (12%).
This signals that receiving institutions still have an opportunity to work more closely with these prospects. Schools recruiting them should look to establish partnerships with two-year schools to coordinate advising. Likewise, these leaders could assign advisors to meet with transfer students considering their institutions, help transfer students choose a major before transferring, or create first-year experiences to increase their connections to the campus.
Without these supports, the navigation burden falls on the shoulders of transfer students from community colleges or two-year institutions. It increases the risk they enter four-year institutions ill-prepared or struggle to achieve success—or fail to enroll at all.
The Hub of Student Recruitment is Not Your Campus
By Johanna Trovato, Senior Analyst
In 2021 I learned that in times of increased virtual activity, prospective students trust the institutional websites more than ever as an information source. Our survey data has long confirmed that school websites are among the most heavily used information sources, but use and trust don’t always correlate. Trust indicates that students may rely on this source as a continued reference in their decision making—beyond the initial familiarization with an institution.
Figure 4 shows the top 10 most trusted sources of information about college among college-bound high school students, according to our 2021 and 2019 Student Sentiment Research™.
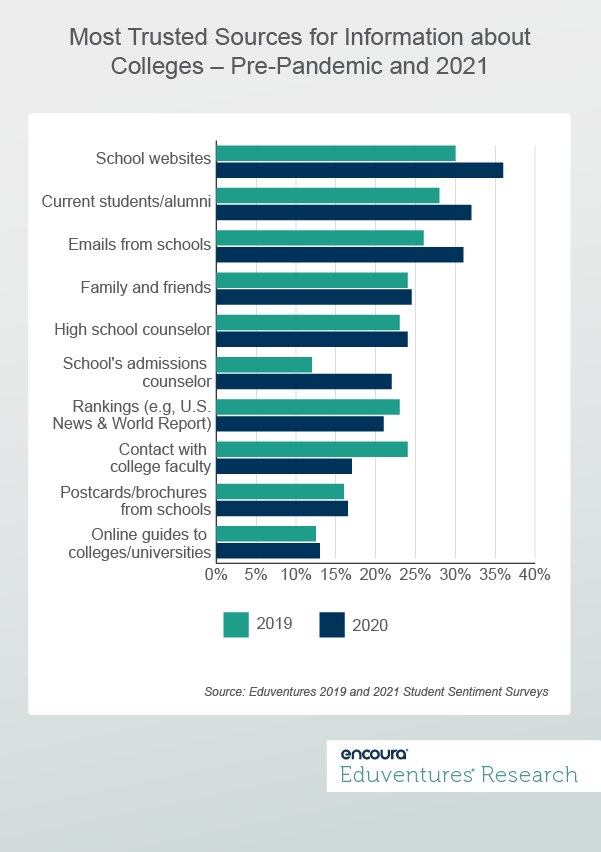
While school websites were on top before the pandemic, they received a boost in the virtual recruitment environment as many recruitment activities moved online. A “school’s admissions counselor” and “emails from schools” also enjoyed a pandemic boost, but still lag behind the trust students put into the information conveyed on your website.
Perhaps most notably, Figure 4 shows that trust in websites has even pulled ahead of trust in current students/alumni, family and friends, and faculty! While this may seem surprising, it is important to remember that your website is the virtual gateway to your institution, the portal to many other resources. It connects prospects to student voices and stories. It has truly become a multifaceted recruitment hub between students and your social media presence, virtual and in-person campus tours, and your admissions team.
Given this important role, I was heartened to visit many websites throughout the year that embraced its central role as a recruitment tool in the virtual recruitment environment. Yet, I still came across websites that were less than ideal in layout, navigation, or content. Insufficient resources are often the barrier to improvement.
My hope for 2022 is that more schools will be able to make this a priority – and build successful future student pipelines in the process.
The COVID Shock May Be Waning for Adult Undergraduate Degree Prospects
By Clint Raine, Senior Analyst
In 2021, I learned that “committed” adult undergraduate prospects—those reporting they will either definitely or probably enroll in the next three years—are on the rebound. While swirling unknowns around health, family, and the economy drove “committed” prospects down by June 2020, new Eduventures data suggests some of those concerns have worn off.
Building on prior survey analysis, our October 2021 Adult Prospect Survey™ reveals that the proportion of “Committed” prospects in Fall 2021 is higher than pre-pandemic levels and almost double that seen during the initial pandemic shock. Figure 5 shows how commitment among adult prospects has trended from July 2019 (pre-pandemic) to today.
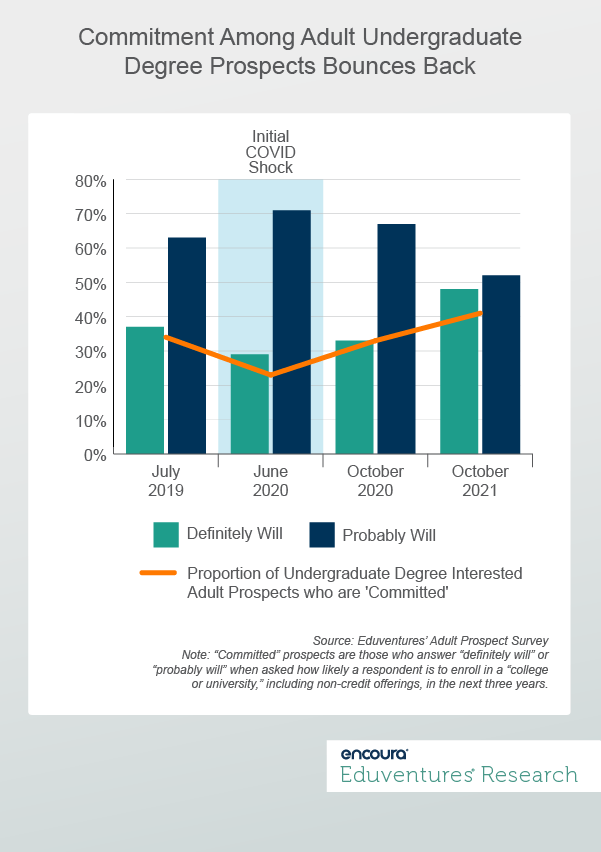
Our data also reveals that the highest proportion of committed prospects said that they “definitely will” enroll as opposed to “probably will,” in Fall 2021 (48%) signaling that these committed prospects are even more serious about future enrollment than they were pre-pandemic. This forward-looking measure of demand may signal a break in the clouds for schools beleaguered by falling adult undergraduate enrollment over the last decade.
Why might commitment be on the rise? While COVID-19 spurred only a brief recession, this masks the economic ups and downs over the last 18 months that may have these undergraduate degree prospects increasingly thinking of future economic security. Additionally, the pandemic has ushered in an intense period of reflection and introspection among workers—a.k.a. the Great Resignation—who are seeking better jobs or opportunities to follow their passions.
Perhaps in 2022 and beyond, higher education may very well play a role in their next moves.
Never Miss Your Wake-Up Call
Learn more about our team of expert research analysts here.
The Program Strength Assessment (PSA) is a data-driven way for higher education leaders to objectively evaluate their programs against internal and external benchmarks. By leveraging the unparalleled data sets and deep expertise of Eduventures, we’re able to objectively identify where your program strengths intersect with traditional, adult, and graduate students’ values, so you can create a productive and distinctive program portfolio.

